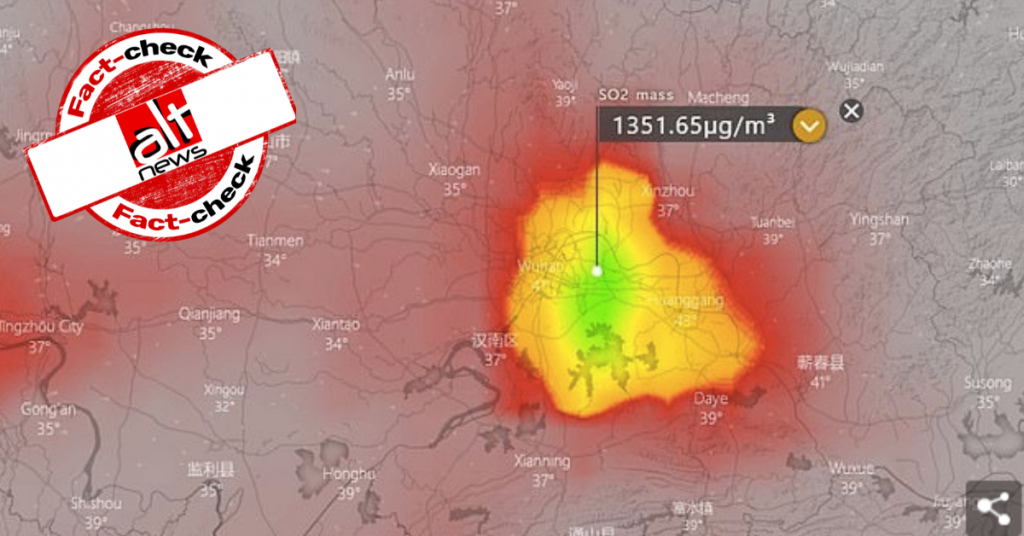
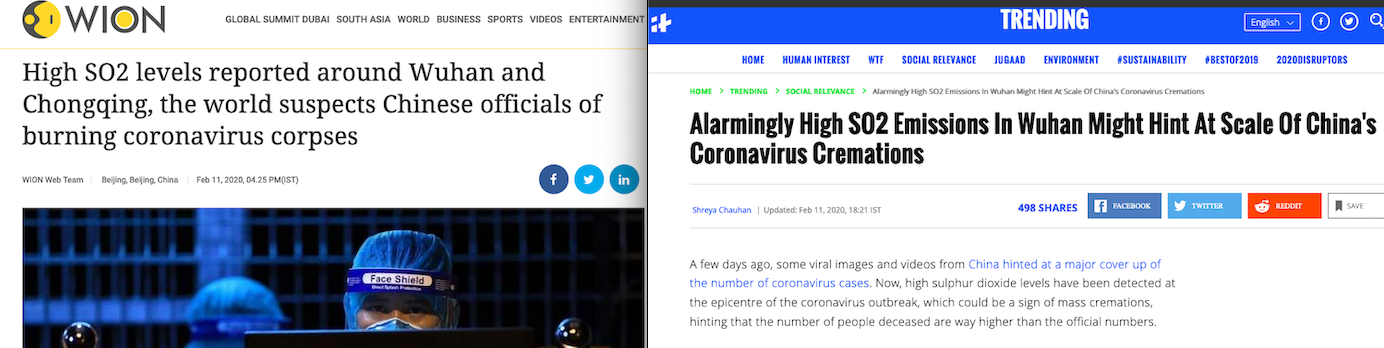
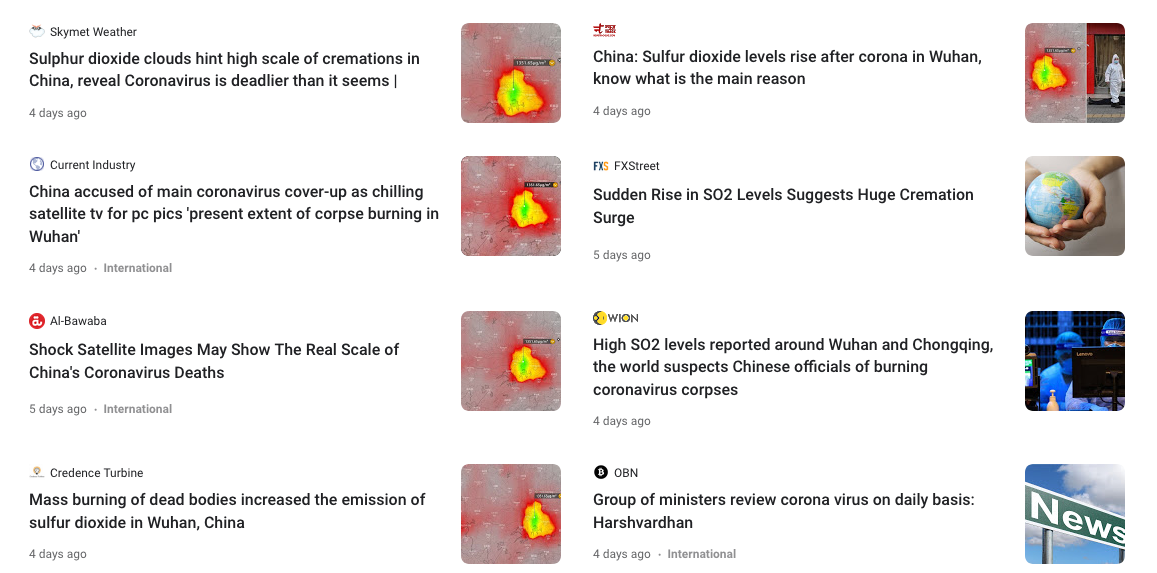
Since February 10, several media outlets – national and international – have published a report saying that an increase in sulfur dioxide levels in Wuhan and Chongqing is possibly linked with mass cremation of coronavirus victims. These reports include a screenshot of an image from windy.com, a Czech-based weather service, as the primary source to show “sulfur dioxide levels in Wuhan were at a staggering 1,350 micrograms per cubic meter (µg/m3).”
Some of the media organizations which published this report are Daily Mail, The Sun (archive link), WION (archive link) and India Times.
On February 9, Twitter account @inteldotwav posted (archive link) the same image from Windy and said that massive release of sulfur dioxide (SO2) gas from the outskirts of Wuhan is commonly associated with the burning of organic matters. Since then it has been retweeted over 12,000 times.
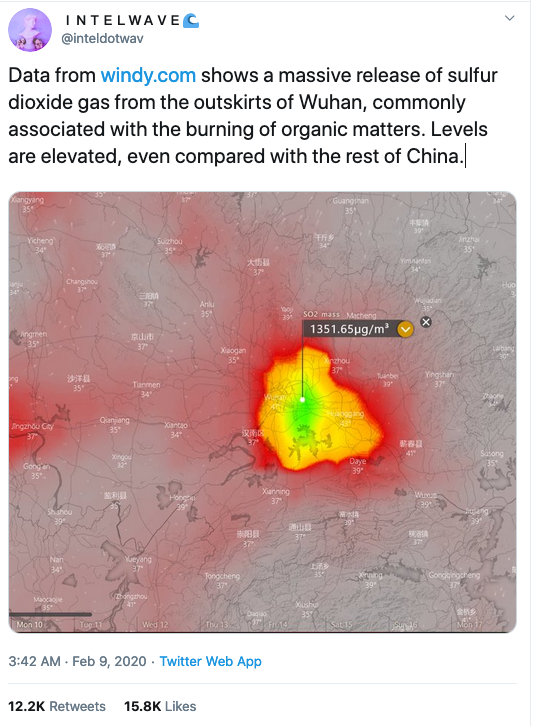
Even @livecrisisnews, a Twitter account that claims to offer reliable news on pandemics (as per Twitter bio) also shared this screenshot and posted (archive link), “Sulfur dioxide gas in Wuhan, commonly associated with the burning of organic matters”. What are they burning? #coronavirus #coronavirusoutbreak #wuhan source: windy.com”
Less reporting, more speculation
The articles by Daily Mail, The Sun (archive link), WION (archive link) and India Times speculate that an increase in SO2 level indicate that mass cremations could be taking place in Wuhan and Chongqing. This wasn’t backed with evidence and the reports add that the same hasn’t been verified. For instance, The Sun’s article reads, “But it is not certain that the high SO2 levels are due to burning virus victims because the colourless gas is also produced by the burning of fossil fuels like coal and oil and through industry.”
India Times and Daily Mail have pulled down their reports.
Fact-check
Expert opinion
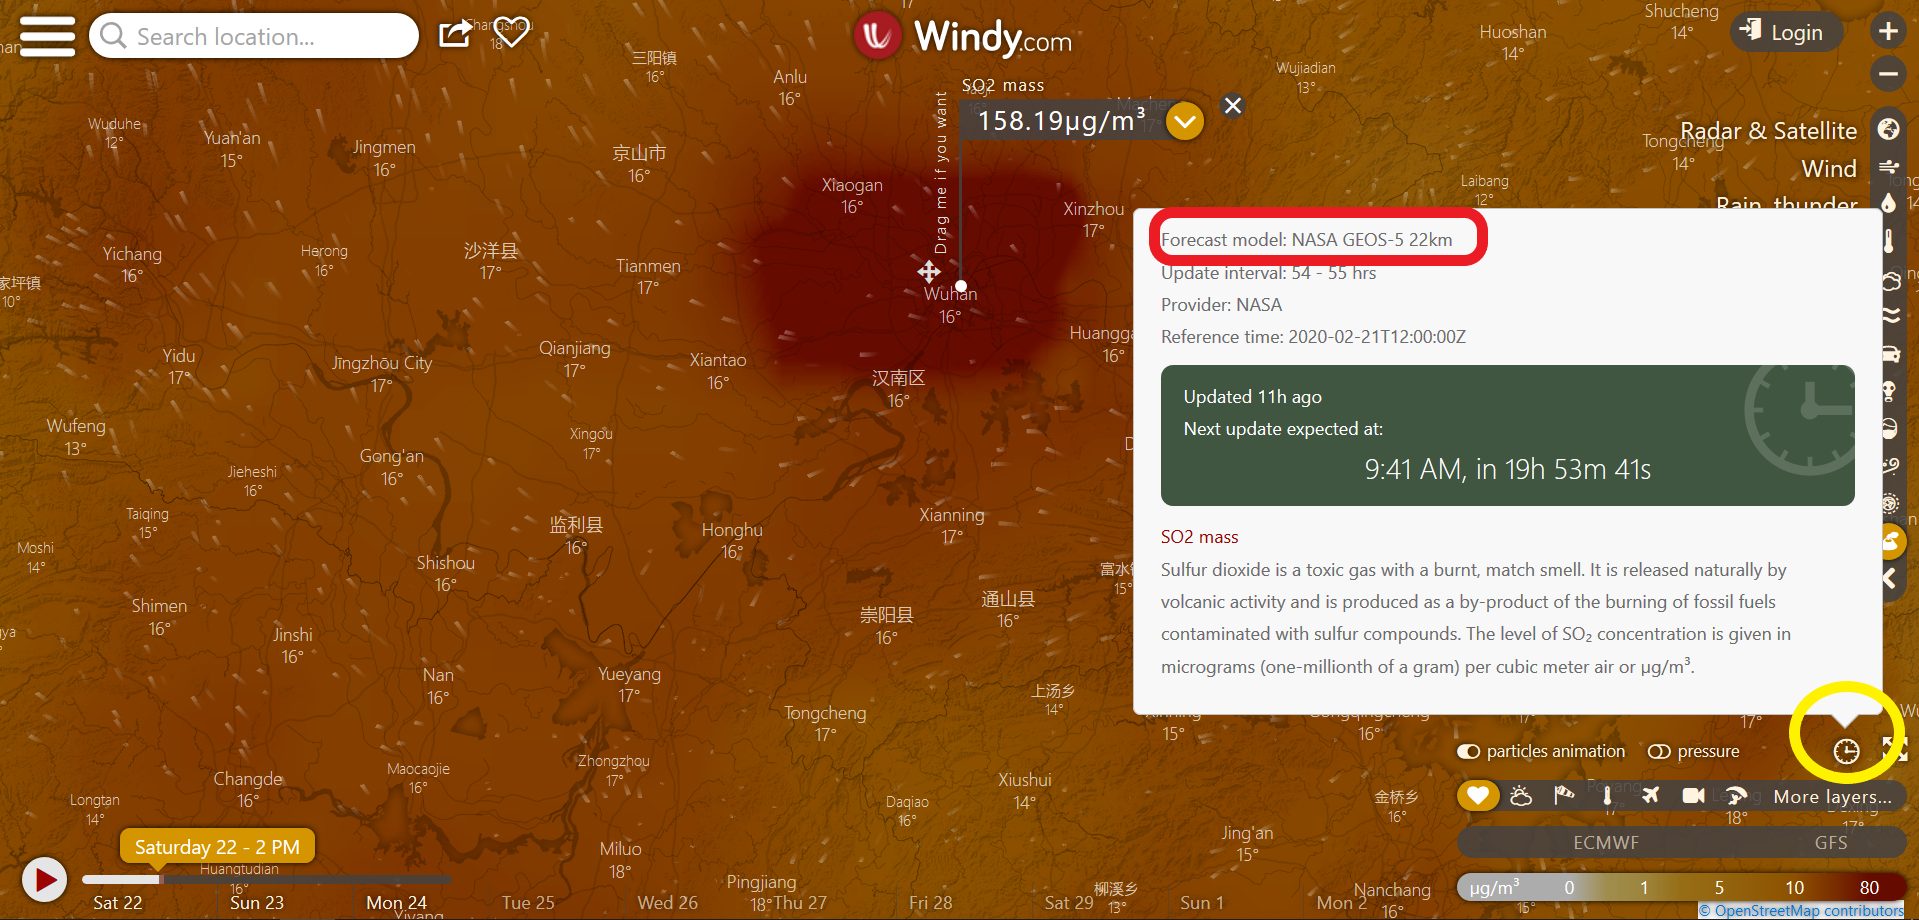
Alt News reached out to Raj Bhagat Palanichamy, a remote sensing expert at World Resources Institute, India. “The images that have been shared as satellite images are not really satellite images. These are in fact results of the GEOS-5 Model which are visualized and shared by windy.com. The ones shown in images are forecasted levels of SO2 and are not observations,” said Palanichamy.
Palanichamy added, “The GEOS-5 model uses emission inventories which had been created prior to model runs and the forecast runs do not include live observations. Any short term (particularly unpredictable) change in artificial pollutant sources won’t play any role in the outcome of the model. The SO2 forecast maps produced by models hence should not be related to Novel Coronavirus or socio-economic effects caused by it. On the other hand, SO2 levels could be monitored by ground stations and satellite images. They don’t show any unusual changes in the said time periods as the news articles claim.”
When Alt News inquired why were the Windy readings so high, Palanichamy explained, “The Windy image being a model based on emission inventories for artificial sources and the dispersion of pollutants is determined by meteorological phenomena. Since the model assumes business as usual scenario for artificial sources and wouldn’t account for short term changes, the highly pollutant Chinese cities like Wuhan have higher values.”
Images represent forecasted SO2 levels, not actual observations
While responding to queries on Windy’s ‘general discussion’ page, Korina Karamalaki, community manager at Windy responded, “windy.com gets the SO2 mass data from NASA model GEOS-5, but we don’t display archive data. There is an explanation of data right in the layer.” The screenshot below shows the Windy homepage – the button highlighted in yellow gives information about data displayed. The section highlighted in red shows that the data is indeed sourced from NASA.
On February 13, Full Fact, a UK-based independent fact-checking charity, reported on the issue. Dr Arlindo M da Silva, a research meteorologist from NASA’s Global Modeling and Assimilation Office, told the organization that the GEOS-5 sulfur dioxide models do not “assimilate real satellite data” into their forecasts, instead are based on past evidence of emission levels.
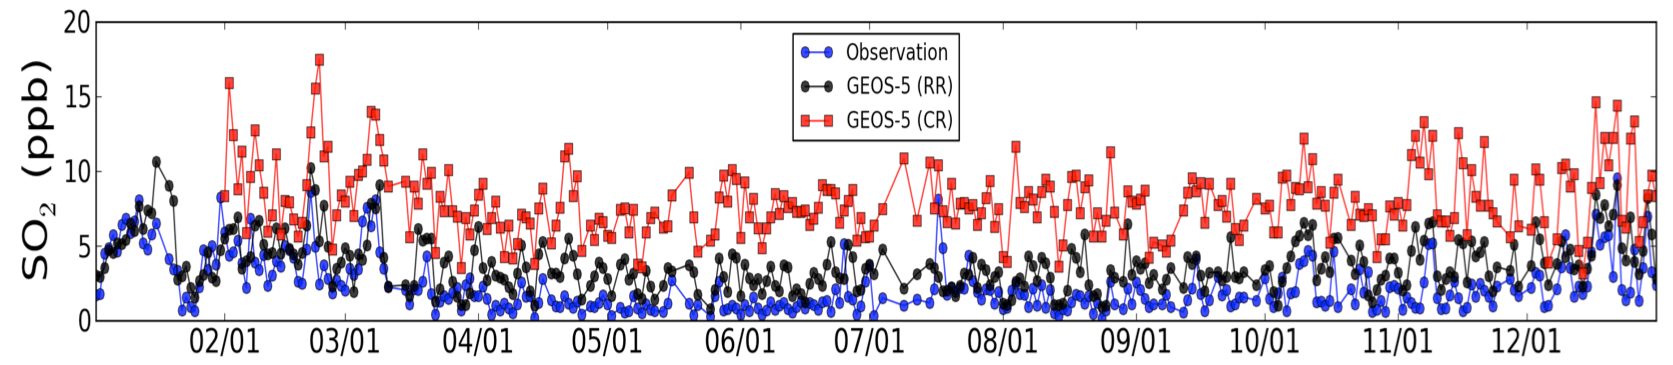
‘Verifying GEOS-5 sulfur dioxide simulations, a 2013 research by NASA’s Global Modelling and Assimilation Office, stated, “when comparing modelled SO2 with observed (blue) SO2 from a sampling station during the 2010 Frostburg field campaign, the control run (red) overestimated SO2 by a factor of 4-5, and though the results were much better in the revised run (black), they were still high.”
Real-time data shows no concerns about SO2 levels
According to the World Air Quality Index project, a non-profit project started in 2007, the index of SO2 level in Wuhan has been rated good air quality index since February 10 (Monday).
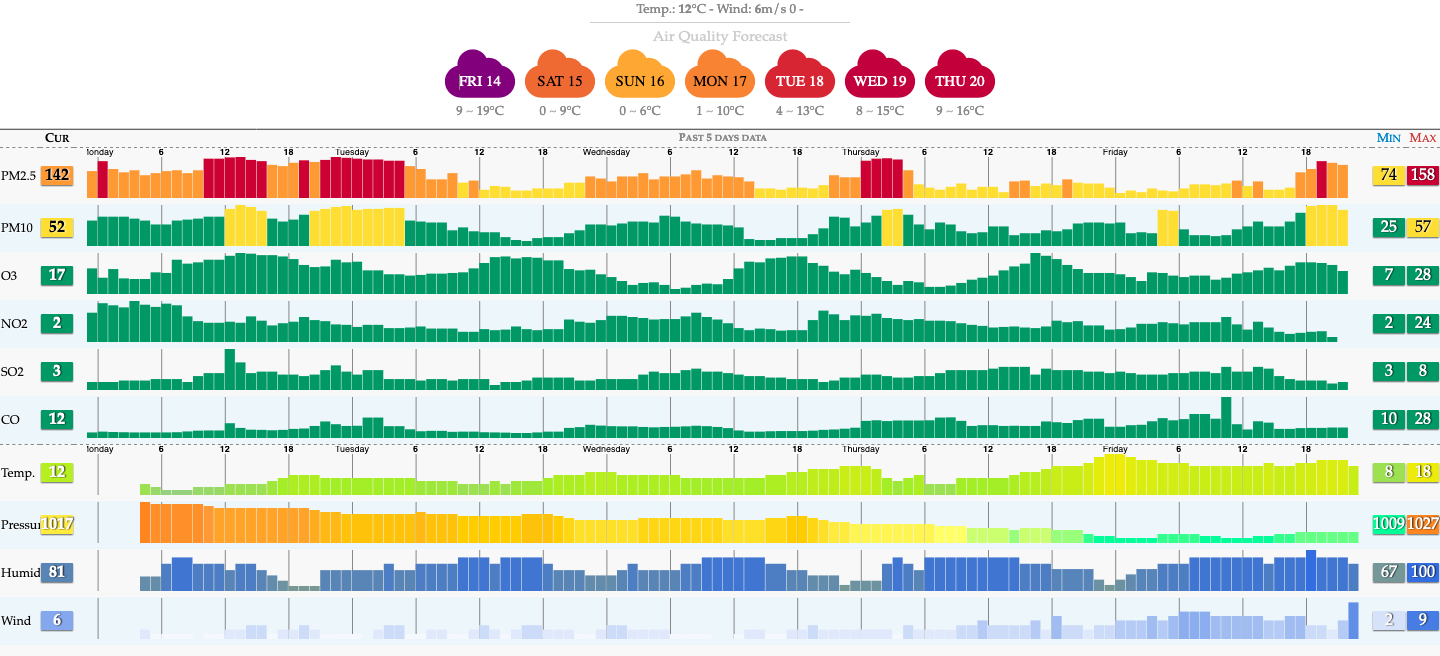
The project provides air quality information for more than 100 countries, covering more than 12,000 stations in 1,000 major cities, via two websites: aqicn.org and waqi.info.
Some facts about SO2 levels generated during cremations
‘Emission characteristics of harmful air pollutants from cremators in Beijing, China,’ a journal published in May 2018 by National Center for Biotechnology Information studies states, “The process of corpse cremation generates numerous harmful air pollutants, including particulate matter (PM), sulfur dioxide (SO2), nitrogen oxides (NOx), volatile organic compounds (VOCs), and heavy metals.” The emission concentrations are affected by various factors such as “fuel type, cremator type, flue gas post-treatment system and operational maintenance.” The journal provides an infographic that compares the levels of particulate matter and gaseous pollutants emitted with/ without post-treatment.
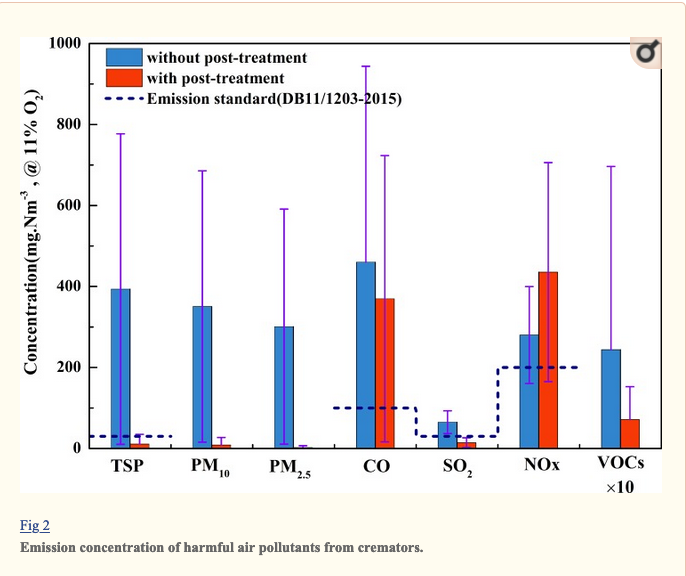
As per the infographic, SO2 concentration is the least out of all the pollutants. Neither did any media reports mention this fact, nor did they provide any information on the emissions of other major pollutants during cremations.
Open, a Milan-based nonprofit media organization, also published a fact-check on February 12. They reached out to Pellegrino Conte, a chemistry professor at the University of Palermo, who said concentration must be greater than 50 micrograms/kg in order to have damage. As per Conte’s calculation, 50 micrograms of SO2 per cubic meter of air in the first 10-kilometres of Wuhan’s air space would mean 30 million bodies have been cremated. Euro News also quoted Conte in their fact-check on February 13.
Therefore, the claim that the increase in sulfur dioxide (SO2) might be a sign of mass cremations in Wuhan cannot be ascertained using windy.com’s data. As per the World Air Quality Index, SO2 levels in Wuhan are not concerning.